Knowledge Hub > ARTICLES
Learn more about how Accedo One Insights' analytics platform can help you make informed OTT content strategy decisions.

Up-to-date performance data is vital for running a successful OTT streaming service. How many users are viewing your content, and when are they watching? Which content are they watching the most, and where are they viewing from? All this data can provide a competent baseline of OTT insights from which to draw when making content and strategy decisions.
Accedo One - an OTT platform with advanced analytics - is built, and continues to be developed, to give you the data you need to help you make your service succeed.
“Overview” tab
On this tab, you will find all high-level data points relating to your service.
Data Time Spans
Data can be retrieved for the following predefined periods:
To change your selection of day, week, month or year, click on the date selector (e.g. “May 25” if a month is selected) and select your new desired date range.

Active Users
This metric quantifies the number of unique users (or devices, in the case of anonymous usage) who initiated service interaction within the selected time period. If user authentication is implemented, multiple devices using the same credentials are consolidated and counted as a single active user.
Tracked data includes:
Platform Distribution: A breakdown of active users across different platforms (e.g., iOS, Android, Web) during the selected period, along with changes in platform usage compared to the previous period.

Hours Watched
This section summarizes cumulative content playback across all users during the chosen time period.
Data presentation varies by time span:

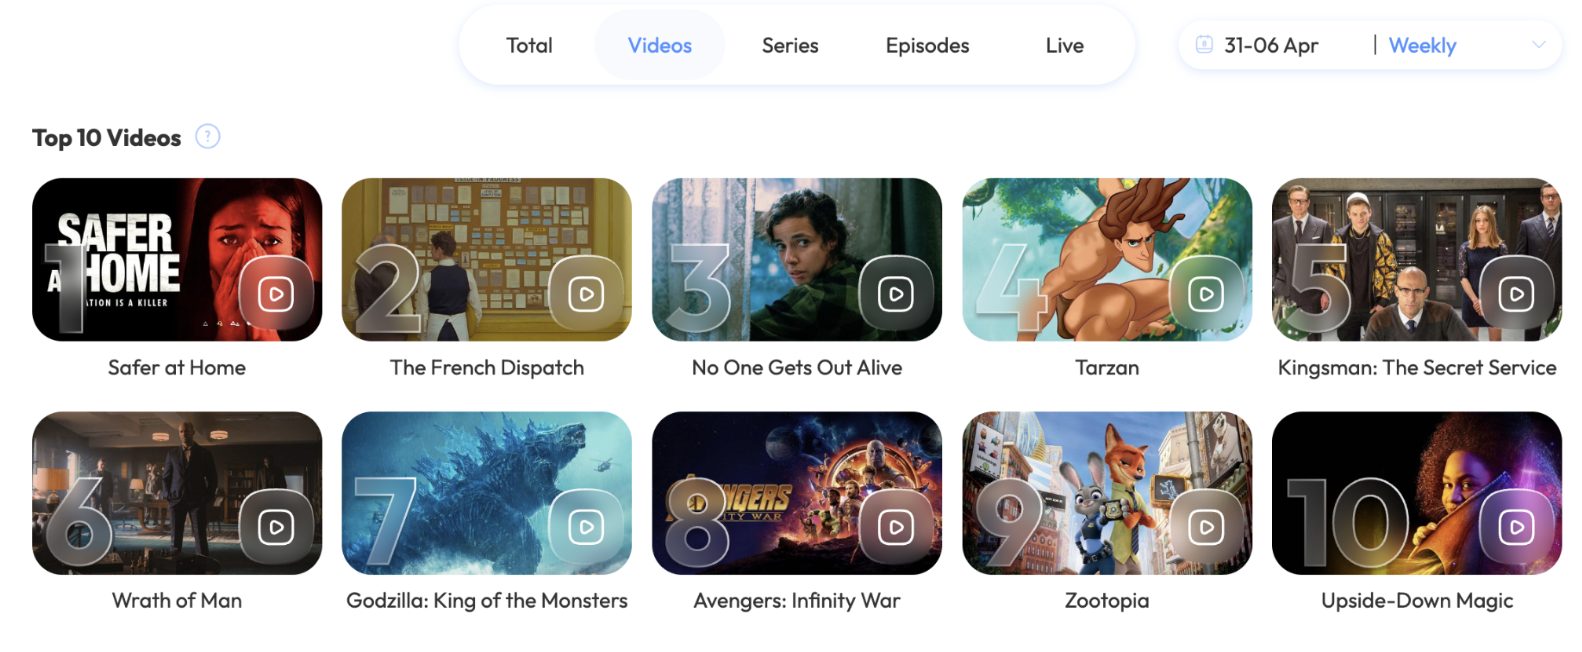
Top 10 Lists
These lists rank content based on total hours watched, applicable to individual videos and channels. For series, the score aggregates hours watched across all associated episodes.
Categories include:
Single Video Analytics
By clicking on a video or show, you can view more detailed information about each piece of content. The data always covers the last 28 days prior to the current date.
Tracked data includes:

For shows, you are additionally able to see a breakdown over seasons and episodes.

The “overview” tab already covers the top 10 videos and shows, but you may want to be able to view detailed data on your entire catalog. This is why we have the “Videos” tab, where you can search, or browse, data for any videos, shows, live streams, seasons, and episodes in your service. Click on a thumbnail to view the detailed data breakdown for this asset.

This tab lets you view detailed data on usage per platform, device and app version.
Speak with one of our video experts to see how far your video service can go.
Contact Us


Lorem ipsum dolor sit amet, consectetur adipiscing elit. Suspendisse varius enim in eros elementum tristique. Duis cursus, mi quis viverra ornare, eros dolor interdum nulla, ut commodo diam libero vitae erat. Aenean faucibus nibh et justo cursus id rutrum lorem imperdiet. Nunc ut sem vitae risus tristique posuere.


